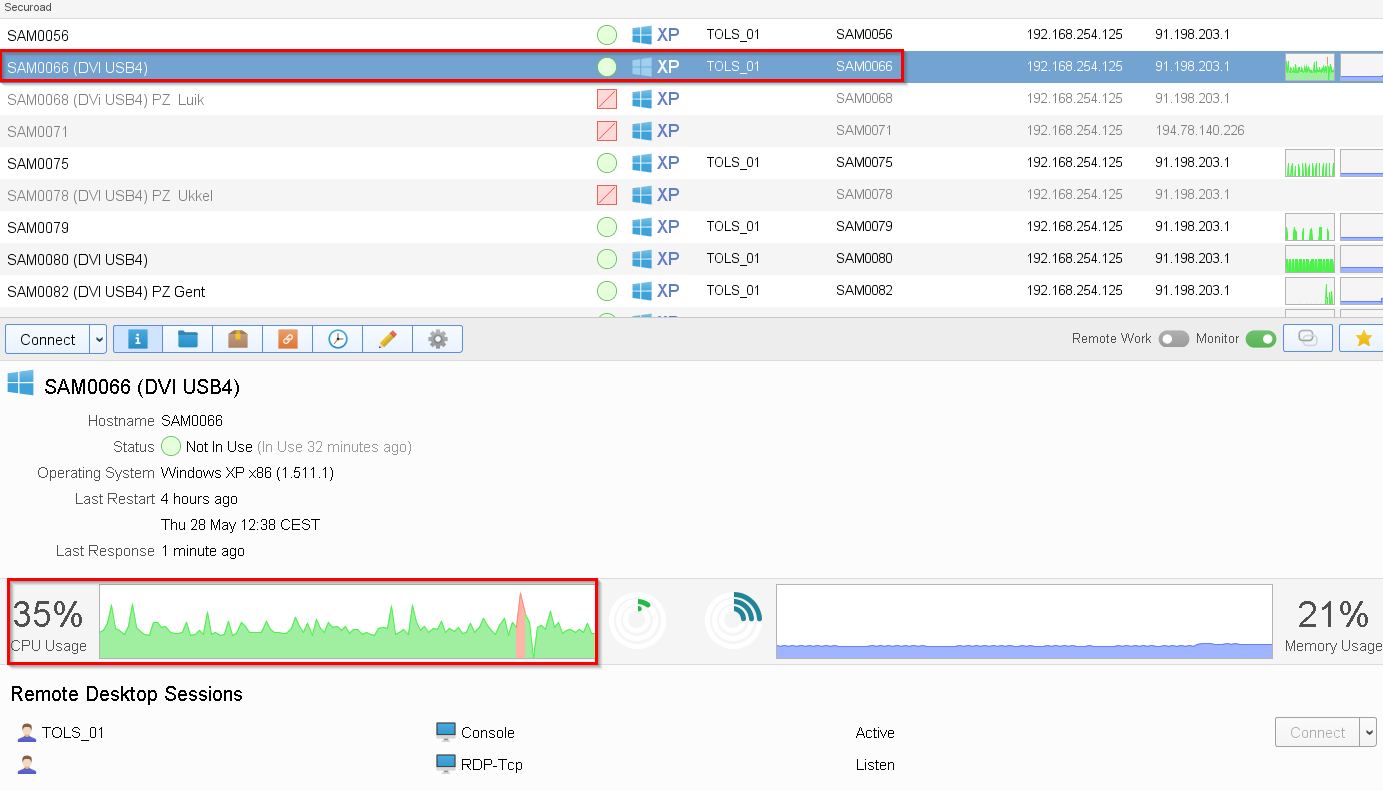
The graph shows 35%, but is that the total CPU usage or the CPU average CPU Usage for 15m?
Or is that only for CPU 1?
If I want the same Graph in Zabbix, which item key should I use?
Or how can I represent this Graph in Zabbix? (Zabbix is my favorite monitoring solution)
Note that this are Windows XP x86 machines.
These machines only have 1 CPU, with 2 cores. Does that mean that it measures the total amount of the 2 cores for this CPU?
Ah. Not sure. I dont have an xp machine to test with. I am using windows 10 1909.
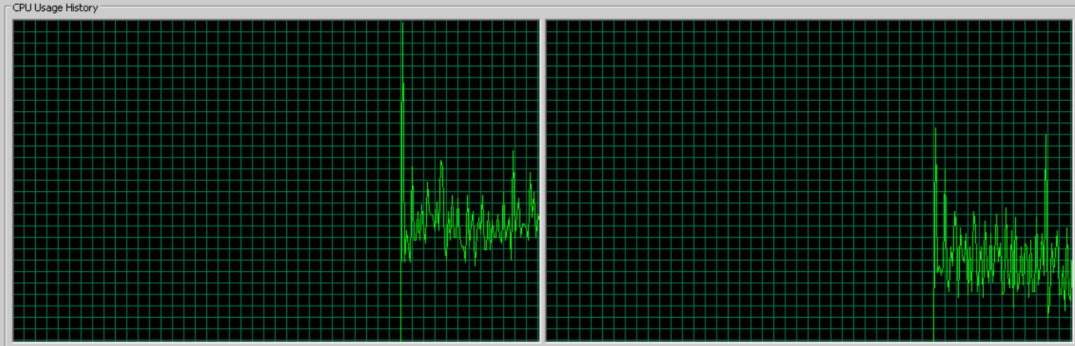
It looks like the graph your looking at in xp is the logical processor graph, not the overall. Change the graph to overall utilization and see if it matches.
For the total amount of the 2 cores, yes I believe it does based on my testing. However, I dont have any proof.
Your best bet would probably be to email support and ask them. If you do, please post back here what you find.