We’re new to SimpleHelp. Enjoying the product so far. Does the “Monitor” toggle determine whether Alerts will be run against a particular endpoint (service)?
If so, is there a way to default to on for all machines? It’s tough to make sure they are all on.
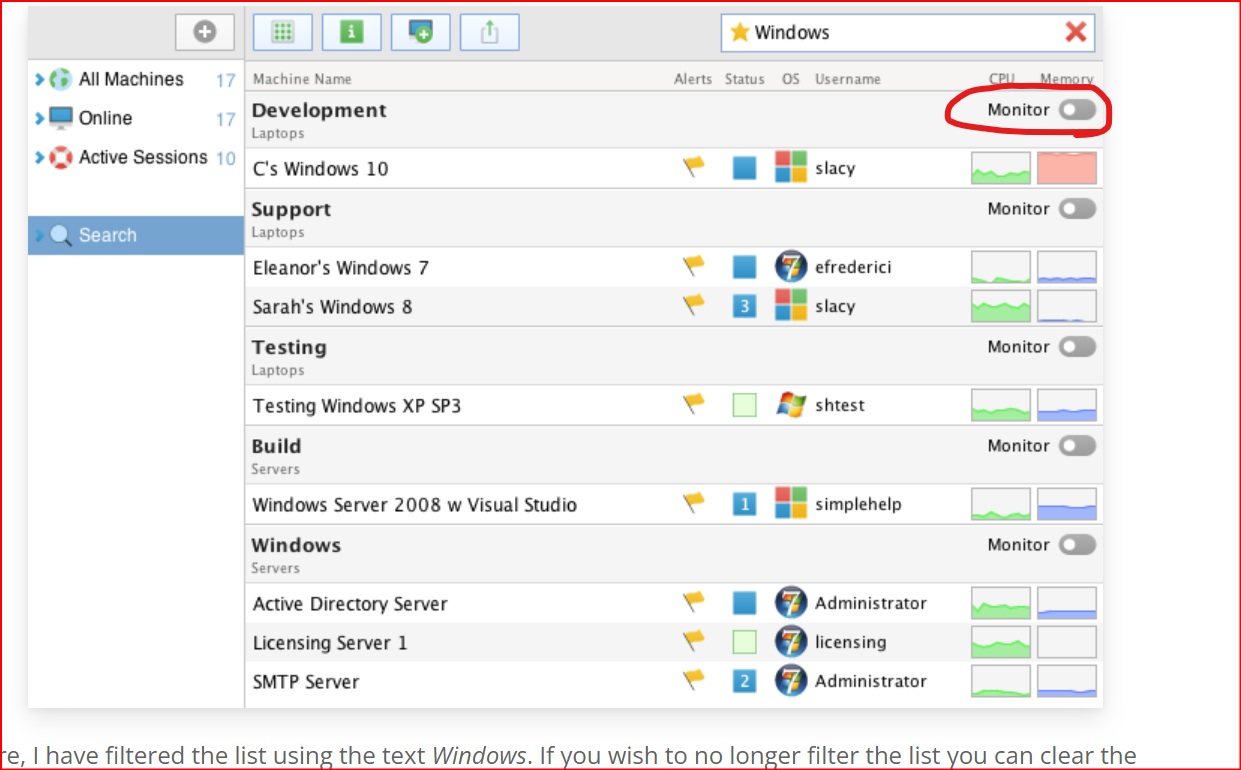
Please post a screenshot of what you a referring to.
I believe what your talking about is the “Monitor” Toggle on each group/machine. This is for live monitoring of the machine. This allows you to monitor the machine live in the technician console without connecting and disrupting the user’s session.
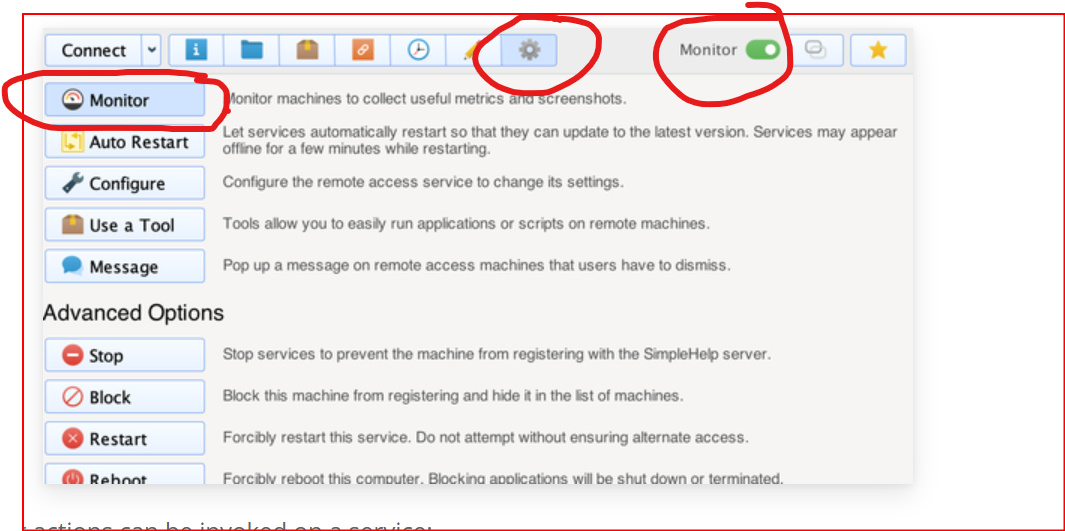
There is a toggle for groups and a button for each machine under settings.
https://simple-help.com/technician-guide#Managing-Machines
Perfect, thank you! I appreciate the clarification.
Always felt it was the “snoop” button 
To be honest I’m still a little unclear on exactly what this does. Is it really just the CPU/Memory graph and a screen shot? Or, does it trigger other things?
Is this required to be on to facilitate triggering of alerts against a machine?
Do people usually leave this off, and only turn it on when working on a particular machine?
Sorry for the silly questions, but we’re coming from Datto RMM, Kaseya, Connectwise Automate, so we’re just used to much deeper systems.
It polls Disk usage, Remote Desktop Session, CPU usage, Memory Usage, Process, Screenshots.
Unless you need to actively monitor a machine, or group of machines in real time, it’s normally left off, because it does use resources on the remote machine, and server, although not much. It could be a lot though if you have a ton of machines.
It is not used to facilitate the triggering of alerts, scripts, or anything else that I am aware of. If someone knows different please let me know. 
Not silly at all. It would be silly not to ask questions and get frustrated.
Simple-Help is simple but powerful. That’s why I like it.
2 Likes
 Remote Support
 Remote Access
 Monitoring and Management
 Presentation
 Remote Work
 Standard
 Business
 Enterprise